 Skip to content
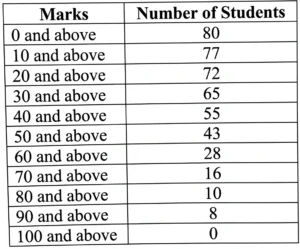
Q) The marks obtained by 80 students of class X in a mock test of Mathematics are given below in the table. Find median and the mode of the data:
(Q 33 – 30/1/3 – CBSE 2026 Question Paper)
Ans:
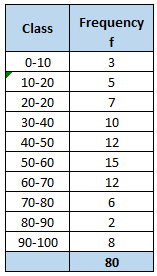
Let’s first rearrange the given data in terms of grouped data:
(i) Median value:
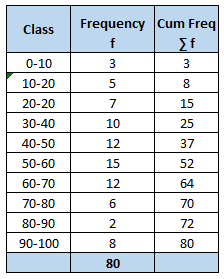
Step 1: To calculate the median value, let’s re-organize the data:
To find the median, we need to first identify median class of the data.
- We know that, Median class is the class where the cumulative frequency crosses 50% of total of frequencies.
- Here, in the given data, total of frequencies is 80, hence 50% of it is 40.
- At “50-60” class, cumulative frequency is crossing 40
- Hence, our Median class = 50-60
Step 4: Next, the median value of a grouped data is given by:
Median = 
Here:
L = Lower boundary of the median class = 50
n = Total number of frequencies = 80
cf = Cumulative frequency of the class before the median class = 37
f = Frequency of the median class = 15
h = Class width = 60 – 50 = 10
hence, the Median = 
= 
= 
= 
= 50 + 2 = 52
Therefore, the median value is 52 marks.
(i) Modal value:
Let’s look at grouped data again:
Step 3: Since the modal class is the class with the highest frequency.
Here, in th egiven table, highest frequency is 15
∵ highest frequency belongs to class “50 – 60”
∴ the modal class is “50 – 60”.
Step 4: Now mode of the grouped data is calculated by:
Mode = 
Here,
L = lower class limit of modal class = 50
f1 = frequency of modal class = 15
f0 = frequency of class proceeding to modal class = 12
f2 = frequency of class succeeding to modal class = 12
h = class size = 60 – 50 = 10
Let’s put values in the formula and solve:
Mode =
= 
= 
= 50 +  = 50 + 5 = 55
Therefore, the modal value is 55 marks.
Please press the Heart button, if you like this solution.