 Skip to content
Q) India meteorological department observes seasonal and annual rainfall every year in different sub-divisions of our country.

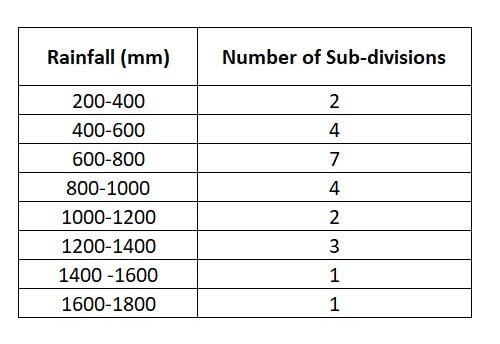
It helps them to compare and analyse the results. The table given below shows sub-division wise seasonal (monsoon) rainfall (mm) in 2018:
Based on the above information, answer the
following questions:
(I) Write the modal class.
(II) Find the median of the given data.
OR
(II) Find the mean rainfall in this season.
(III) If sub-division having at least 1000 mm rainfall during monsoon season, is considered good rainfall sub-division, then how many sub-divisions had good rainfall?
Ans:
VIDEO SOLUTION
STEP BY STEP SOLUTION
Let’s re-organize the data in the frequency table to find out each part:
i) Since the modal class is the class with the highest frequency.

In the given question, class “600-800” has the highest frequency. And 7 sub-divisions are experiencing this rainfall.
Hence, class “600-800” is the modal class.
ii) Median or Mean Rainfall:
To find the median, we need to identify middle value of the data. Let’s rearrange the data:
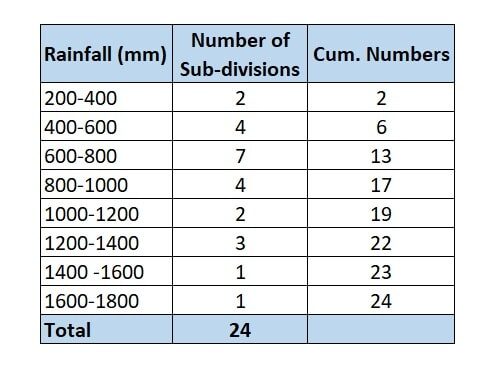
- First, we need to find the cumulative frequency in the frequency table to find the median. Its shown in last column.
- Next, Total number of sub-divisions or Sum of the frequencies = 24. It shown in the last row of middle column.
- Next, we need to identify Median Class. Since the Median class is the class where the cumulative frequency crosses 50% of the half the total number of sub-divisions, here in the table, Cumulative frequency of 13 is crossing 50% of frequency i.e. 12, at class “600-800”. Hence, our Median class = 600-800 mm
- Next, To find the median, we use the formula:
Median = L+ x h
x h
Here:
L = Lower boundary of the median class = 600
n = Total number of sub-divisions = 24
 = Cumulative frequency of the class before the median class = 2 + 4 = 6
f = Frequency of the median class = 7
h = Class width = 800 – 600 = 200
hence, the Median = 600 +  x 200
x 200
⇒ 600 + [(12-6)] x 
⇒ 600 + 
⇒ 600 + 171.428
⇒ 771.43 mm
Therefore, Median = 771.43 mm
OR
(II) Find the mean rainfall in this season.
Let’s re-arrange the data with midpoint of each class, frequency, and multiply midpoint with frequency:

We know that, mean of grouped data is given by:
Mean of grouped data =
Therefore, Mean =  = 850
= 850
Hence, the mean rainfall in the season is 850 mm
(III) Sub-divisions with Good Rainfall:
Given that sub-divisions with at least 1000 mm rainfall are considered to have good rainfall. These sub-divisions are from 1000-1200 mm onwards.

Hence, To find the number of sub-divisions with good rainfall, we add up the frequencies of the classes from 1000-1200 mm to 1600-1800 mm.
Good rainfall sub-divisions = 2 + 3 + 1 + 1 = 7
Therefore, 7 sub-divisions had good rainfall during the monsoon season.
📚 Get Free Worksheet & Share Solution
To download the practice worksheet for this specific topic:
💬 Ask for WorksheetTo help your classmates with this helpful math solution:
Share with Friends